Housing&
Housing Indicator Tool
About this project
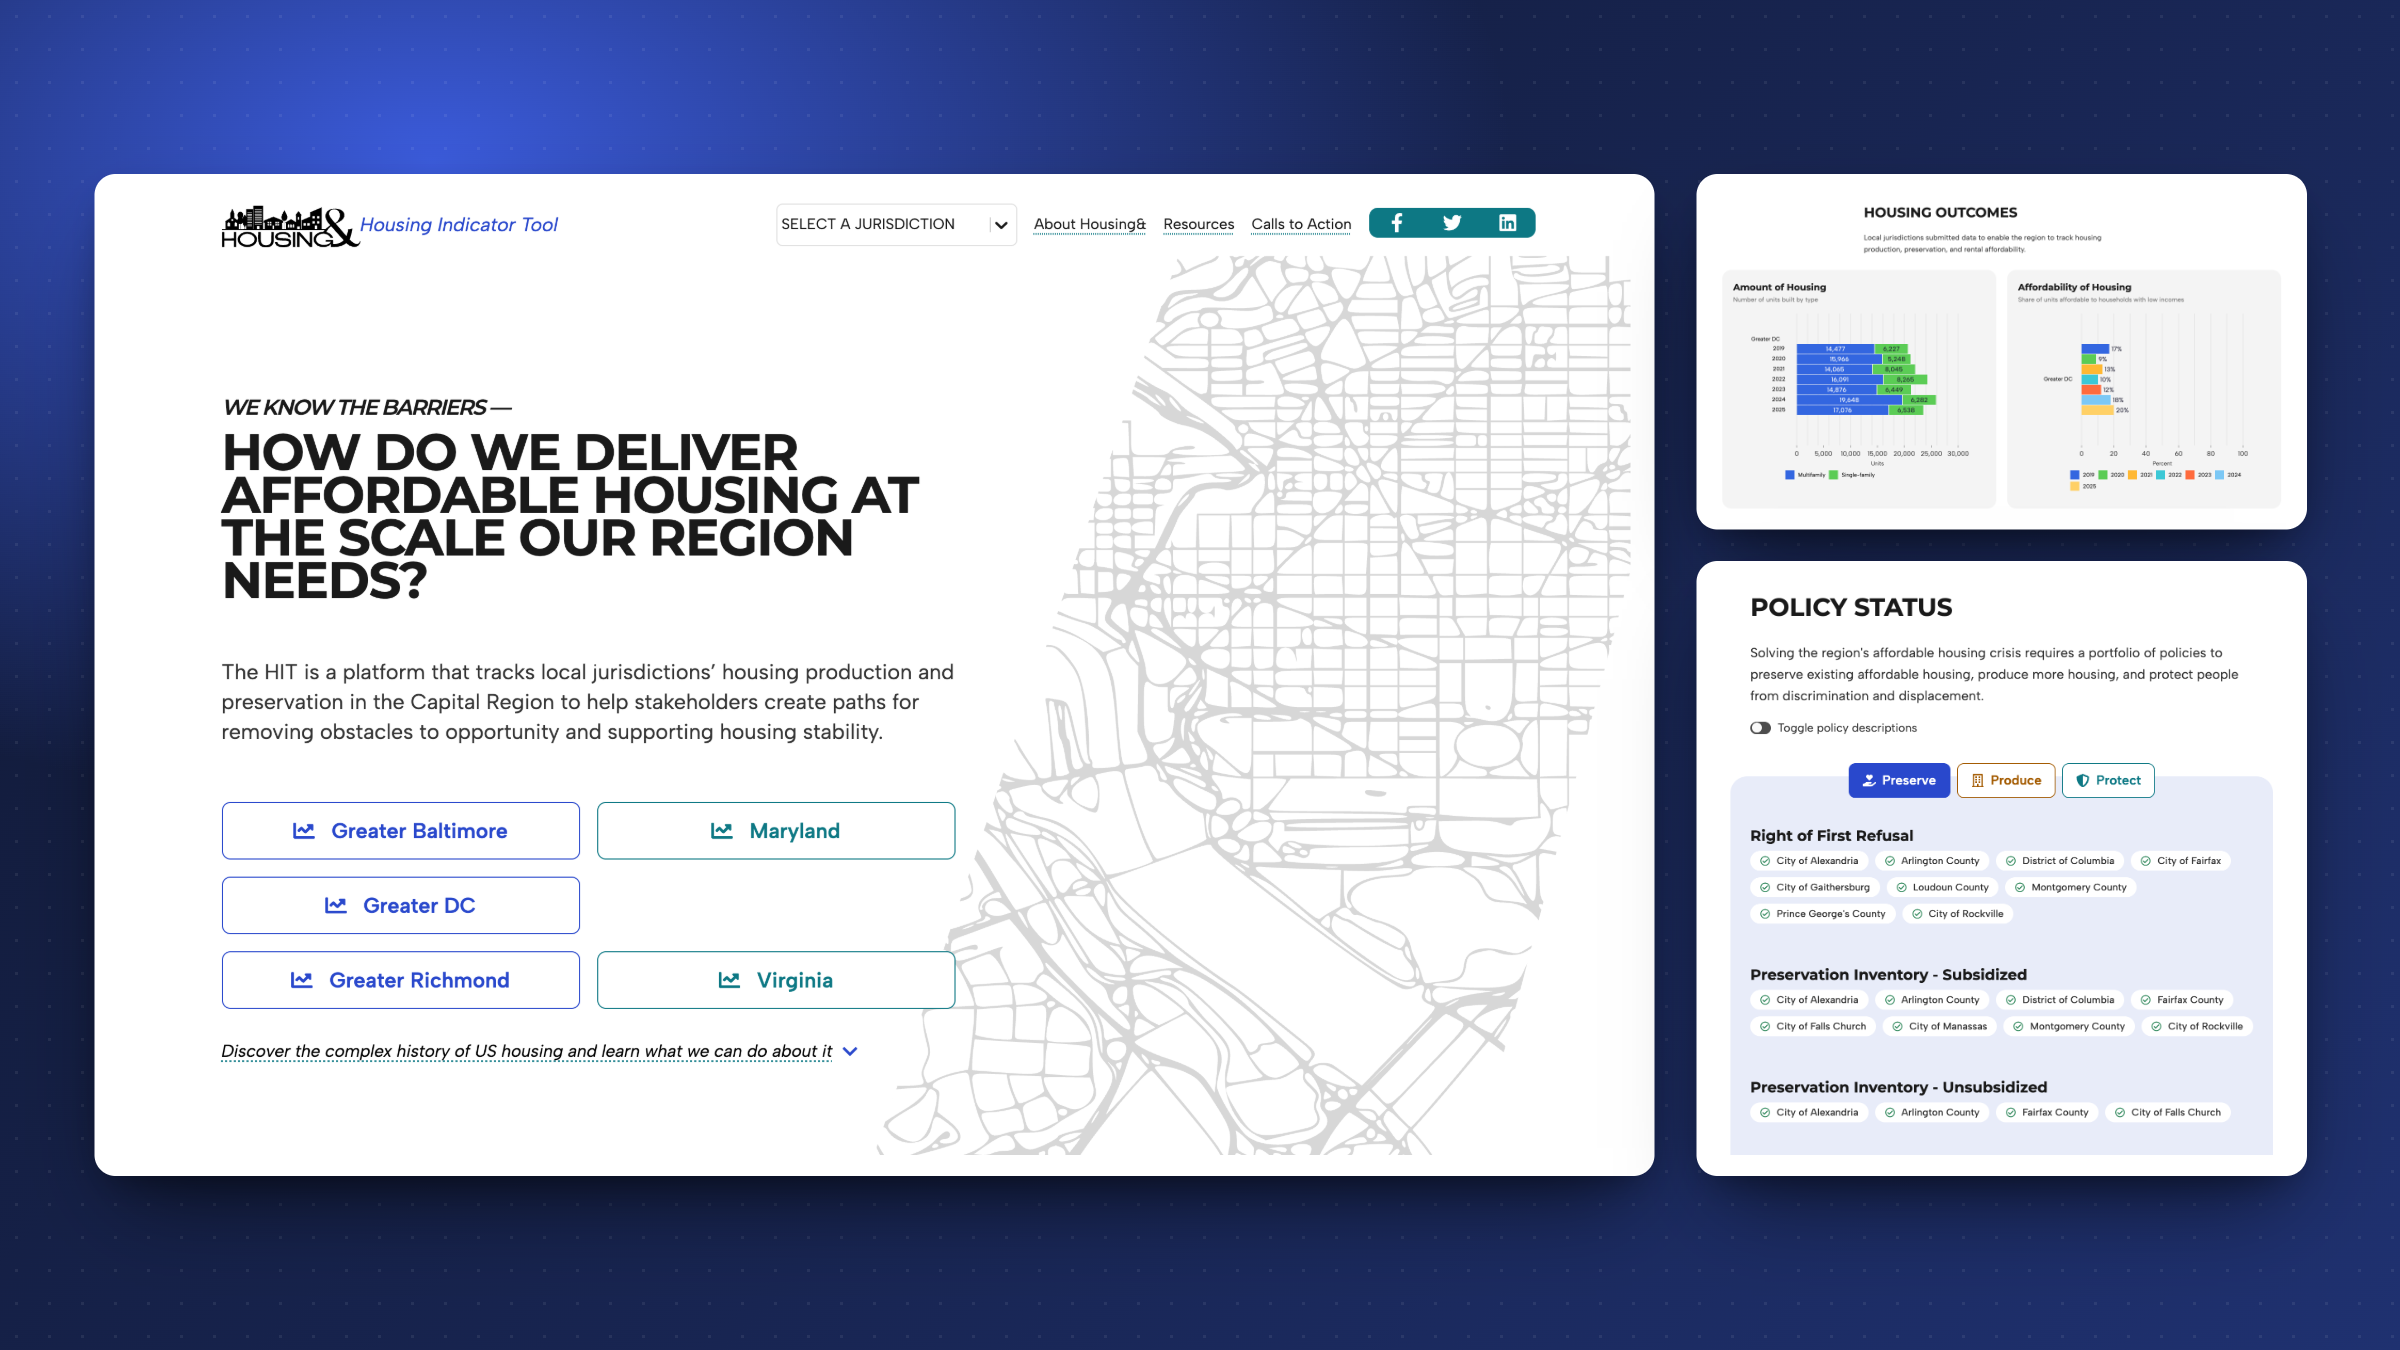
The Housing Indicator Tool is the public scoreboard for a regional housing commitment. In 2019 the Urban Institute called for 374,000 net new homes in the Capital Region between 2015 and 2030. Housing& (formerly HAND) needed a way for elected officials, advocates, journalists and developers to see, jurisdiction by jurisdiction, whether the region was on track.
Mobility Labs has designed and engineered the tool since 2019. It now covers 27 local jurisdictions across the DC, Baltimore and Richmond regions, plus regional totals and statewide totals for Maryland and Virginia. Each new release is unveiled at Housing&’s Annual Meeting and Housing Expo; HIT 6.0 launched at the 35th meeting in May 2026.
The tool is used and cited by the DC Department of Housing and Community Development, the Urban Institute’s National Neighborhood Indicators Partnership, NH&RA and Prosperity Now.
Visit hit.housingand.org (opens in new tab)What the tool shows
Each jurisdiction page tells a layered story: the history of structural racism in housing, production and preservation results, the policies on the books, and the elected officials with the authority to act. The landing page pulls it into a regional picture, with personas based on real worker incomes, policy adoption across Preserve, Produce and Protect, and calls to action for each group of stakeholders.
Every public dataset behind it, from Housing&’s member survey to ACS, HMDA and IPUMS data and member policy audits, can be downloaded from the resources page. Urban Institute researchers review chart axes, labels and footnotes before each release ships.
A data pipeline built for the annual refresh
The hard part is not the charts. It is shipping a new data year, on time, every year, while the inputs change: new column structures from the Urban Institute, another year of survey data, retired and added policy categories, renamed fields in federal datasets.
We built a schema-driven import pipeline. It reads each source, validates only the fields the charts use, warns about anything missing and regenerates the dataset. Adding a year is a small change, and a new data source is one new schema file. When Housing& asks for something in plain English, such as adding a year or switching from MFI to AMI, the change takes days, not weeks.
A rebrand without a rebuild
Partway through the engagement HAND became Housing&, with a new logo, palette, typography and domain. Because the design was built on tokens, the rebrand was a swap rather than a redesign, and we moved the tool from hit.handhousing.org to hit.housingand.org ahead of the launch event. In April 2026 we aligned it with Housing&’s second brand guide.
Small improvements that add up
- An April 2026 performance pass cut the homepage’s initial JavaScript by 68% and its image weight by 99%.
- A dedicated accessibility review of navigation, page sections, charts and colors.
- Charts that stay honest: empty segments are not labelled, label colors adjust for contrast, and low-volume jurisdictions get their own axis ranges.
- A headless WordPress back end, so Housing& staff can update officials, resources and copy without a developer.
Our role
Mobility Labs is the prime engineering contractor. We are the point where Housing&’s staff and its data, content and design partners come together, and we turn their input into a release that ships on schedule.
A plan for every major change is shared before code moves, and Housing&’s policy team runs a quality-control review before each launch; the April 2026 review was turned around in two days.
Key metrics
Annual releases since 2019
Jurisdictions tracked
Less homepage JavaScript after the 2026 performance pass
Sector
Nonprofits
Partners
- Urban InstituteData and research review
- Brick & StoryContent and strategy
- MetaSparkDesign, early phases
Have a similar project?
Let's talk about how we can help you build something great.